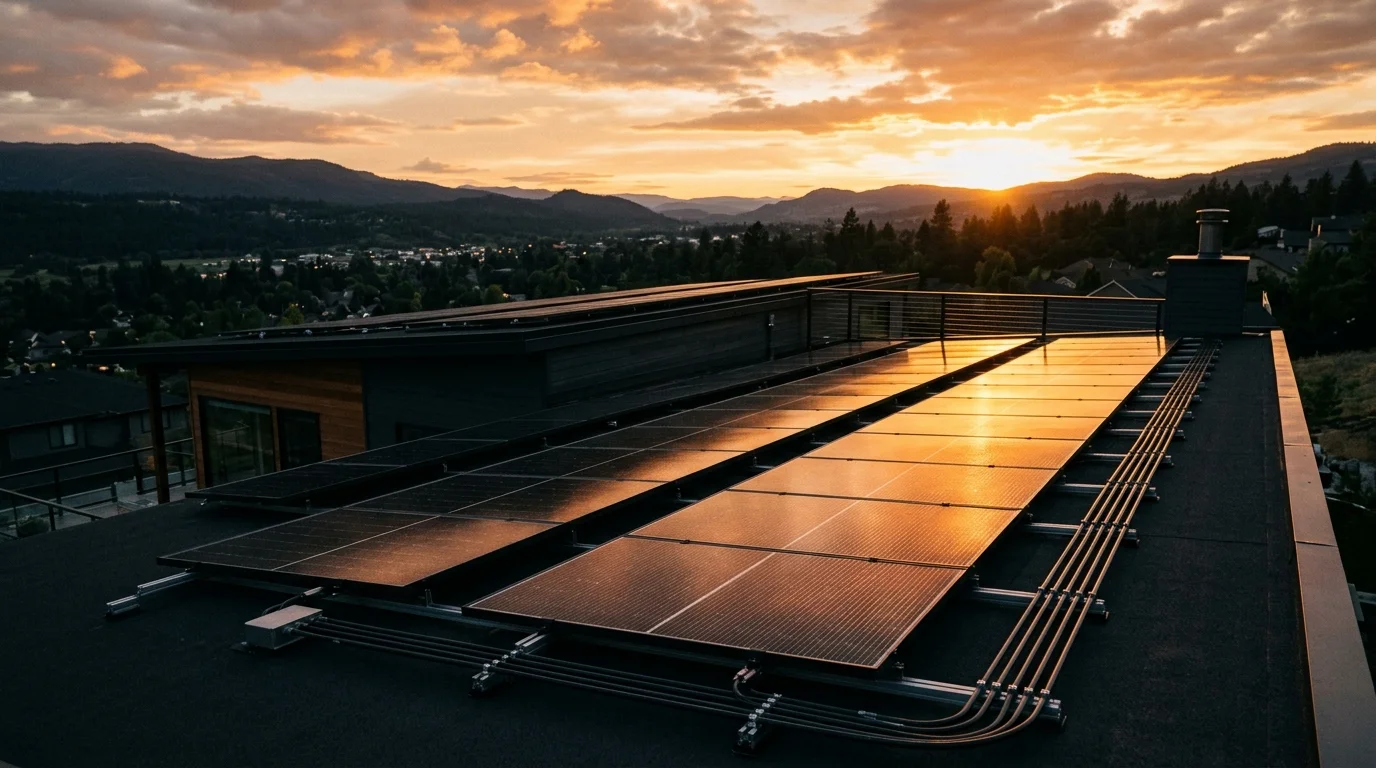
Electricity from municipal utilities is one of the only household expenses with zero equity return. Every month, homeowners write a check for power consumed, building no tangible asset while remaining 100% exposed to compounding utility rate hikes.
Investing in residential solar changes that financial equation. Solar energy transforms an indefinite operational liability into an income-generating, appreciating capital asset that hedges against inflation, delivers a predictable internal rate of return (IRR), and increases property valuation.
However, navigating the true financial return on investment (ROI) requires looking past aggressive sales pitches and calculating hard engineering economics: Gross installation cost, the 30% Federal Investment Tax Credit (ITC), annual panel degradation, utility tariff structures, and Levelized Cost of Energy (LCOE).
At GridSpecLab, our engineering and financial analysts examine real utility rate structures, component degradation curves, and laboratory battery roundtrip efficiencies.
Here is the objective mathematical and technical guide to why solar represents one of the highest-yield, lowest-risk financial investments available to modern homeowners.
For homeowners paying more than 15¢ per kWh for grid power, purchasing an owned solar energy system (cash or clean solar financing) delivers an average Internal Rate of Return (IRR) between 12% and 22%—significantly beating historical S&P 500 index returns on a risk-adjusted basis. A typical 8kW to 10kW residential solar array generates between $35,000 and $75,000 in cumulative net savings over its 25-to-30-year operational life.
Explore High-ROI Solar Kit Options →
The Four Pillars of Solar Financial Return
The financial return of a rooftop or ground-mounted solar system does not rely on a single mechanism. It compounds across four distinct economic pillars:
Avoided Utility Retail Power Costs
Every kilowatt-hour generated on your roof and consumed in your home replaces a unit of power you would have purchased from the utility. At an average of 17¢/kWh (and up to 34¢–45¢ in California, Massachusetts, and Hawaii), an 8kW system generating 11,000 kWh annually saves $1,870 to $4,200 in year one alone.
100% Tax-Free Value Generation
30% Federal Clean Energy Tax Credit
Under Internal Revenue Code Section 25D, homeowners receive an uncapped dollar-for-dollar tax credit equal to 30% of total system costs (equipment, permitting, wiring, and installation labor). A $24,000 installation delivers an immediate $7,200 tax credit.
Applies to Battery Storage Systems
Hedging Compounding Utility Inflation
Over the past 25 years, US residential utility electricity rates have increased at an average annual compound rate of 3.8% to 5.2%. Solar fixes your electricity generation cost at 6¢ to 8¢/kWh, shielding your budget from rising fuel, grid transmission, and wildfire mitigation surcharges.
Locks in Cost for 25+ Years
Substantial Property Value Appreciation
Studies by the Lawrence Berkeley National Laboratory (LBNL) and Zillow demonstrate that owned solar arrays increase home resale premiums by roughly $4,000 to $5,000 per installed kilowatt, while in most states remaining completely exempt from local property tax reassessment.
Owned Systems Add Direct Equity
25-Year Lifecycle Cashflow: Real-World 8kW System Case Study
To see how the numbers work in practice, let’s examine a real-world financial simulation for a standard 8.0 kW DC residential rooftop system installed on an American home consuming roughly 11,000 kWh annually:
| Financial Milestone | Professional Turnkey Install | High-End DIY / Subcontracted Kit |
|---|---|---|
| Gross System Cost ($3.00/W vs $1.60/W) | $24,000 | $12,800 |
| Federal Tax Credit (30% Section 25D) | -$7,200 | -$3,840 |
| Estimated State / Utility Rebates | -$1,000 | -$500 |
| Net Out-of-Pocket Investment | $15,800 | $8,460 |
| Year 1 Avoided Electric Cost (at 18¢/kWh) | $1,980 | $1,980 |
| Simple Payback Period | 7.9 Years | 4.2 Years |
| Cumulative 25-Year Net Electric Savings | $56,400 | $63,700 |
| 25-Year Net Profit (After Equipment Payback) | +$40,600 | +$55,240 |
| Internal Rate of Return (IRR) | 14.2% | 23.8% |
What Happens After the Payback Window?
Once the system crosses its payback threshold (year 4 for DIY kits, year 7 to 8 for turnkey installations), 100% of the electricity generated is pure financial profit. Modern Tier-1 monocrystalline panels (REC, Qcells, Canadian Solar) are backed by 25-year 85% linear power output warranties and routinely operate for 30 to 35 years before replacement.
Levelized Cost of Energy (LCOE): Solar vs Grid Utility
In financial energy engineering, the gold-standard metric for comparing power sources is the Levelized Cost of Energy (LCOE)—the total lifetime cost of building and maintaining an energy system divided by its total lifetime generation:
- Residential Owned Solar LCOE: An 8kW system generating 260,000 kWh over 25 years with a net cost of $15,800 plus a future $2,000 inverter replacement yields an LCOE of 6.8¢ per kWh.
- Utility Grid Average: The average national utility price in the United States currently sits at 17.2¢ per kWh, while high-cost states average 32¢ to 44¢ per kWh.
When you buy solar, you are essentially pre-purchasing 25 years of electricity at under 7 cents per kilowatt-hour—locking in energy costs at an 60% to 80% discount relative to the utility.
The NEM 3.0 Reality: Why Battery Storage Unlocks Modern ROI
In states that previously operated under traditional 1-to-1 Net Energy Metering (NEM 1.0/2.0), solar panels could simply export excess daytime power back to the grid for full retail credit.
Under modern tariffs (such as California’s Net Billing Tariff / NEM 3.0), utilities slashed solar export credits by roughly 70% to 80% (from 30¢ down to roughly 5¢ to 8¢/kWh), while charging peak retail rates (45¢ to 55¢/kWh) between 4:00 PM and 9:00 PM.
Under NEM 3.0 rules, exporting excess solar energy to the utility is a financial loss. Adding a modern 48V LiFePO4 battery storage system (such as EG4 LifePower4 or Tesla Powerwall) captures excess afternoon solar power and discharges it during peak evening hours:
Cash vs Loan vs PPA: Which Financing Method Yields the Best ROI?
How you pay for solar drastically alters your financial outcome:
| Financing Method | Upfront Cost | 25-Year Net Savings | Claims 30% Tax Credit? | Impact on Home Sale |
|---|---|---|---|---|
| Direct Cash Purchase | Full System Price | Maximum ($45,000 – $75,000) | Yes (Direct to Homeowner) | Highest equity increase; clean title transfer. |
| Clean Solar Loan (Credit Union) | $0 Down | Moderate ($30,000 – $50,000) | Yes (Direct to Homeowner) | Loan can be paid off at closing or transferred. |
| Solar PPA / Solar Lease | $0 Down | Lowest ($8,000 – $18,000) | No (Developer Keeps Credit) | UCC-1 lien on title; buyers must assume 25-yr contract. |
Critical Advisory: Avoid high-escalator Solar PPAs if maximum ROI is your objective. Learn why in our complete exposé: What Is a Solar PPA? Pros & Cons Explained.
Top Recommended High-ROI Solar Equipment Kits
If you want to maximize your return on investment and avoid inflated installer margins, these curated complete solar kits and hybrid inverters deliver the lowest cost-per-watt in 2026:
1. Complete Turnkey DIY Solar Kit: ShopSolar Grid-Tied / Off-Grid

ShopSolar Complete Residential Solar Kits (6kW – 15kW)
Engineered pre-sized solar packages including Tier-1 bifacial monocrystalline panels, pre-wired hybrid inverters, solar cabling, and complete permit-ready engineering plans.
Explore ShopSolar Complete Packages →
2. High-Capacity Hybrid Inverter: EG4 18kPV
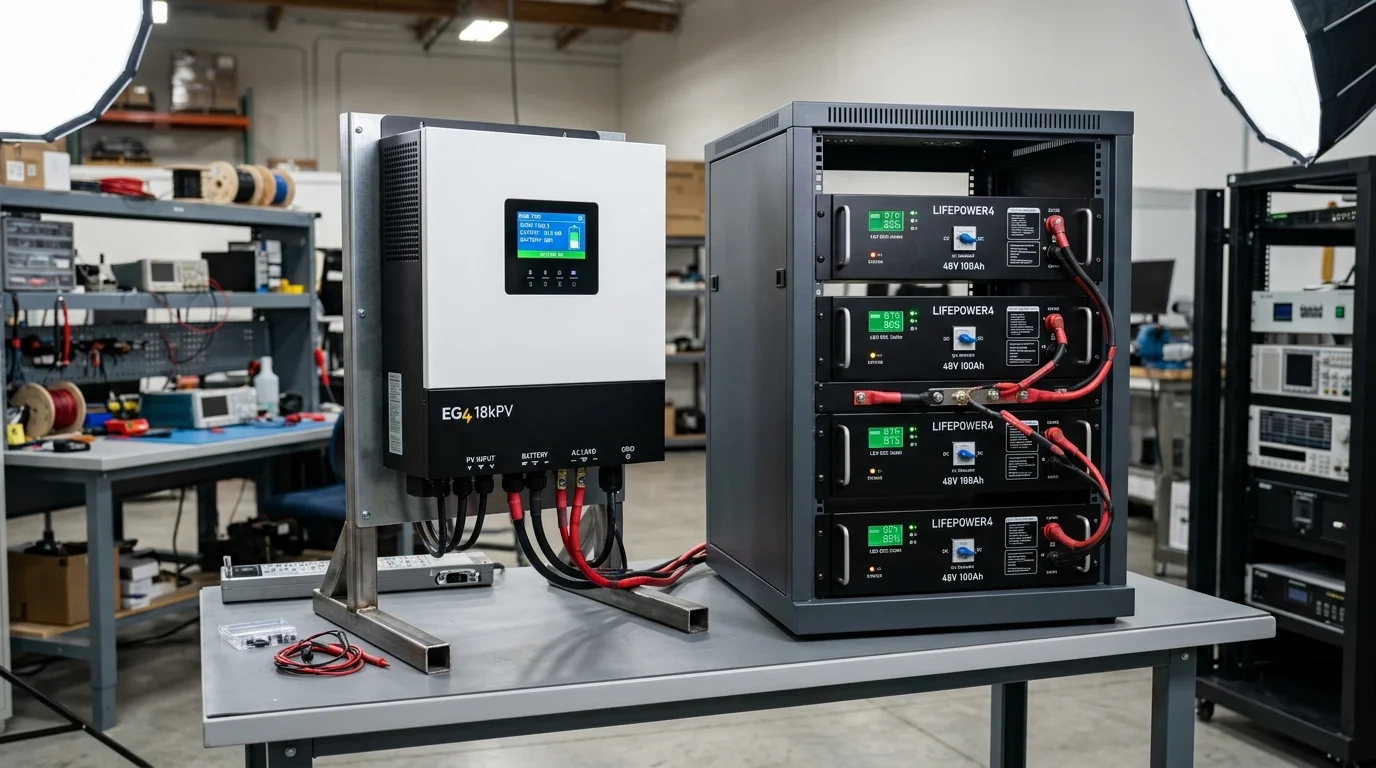
EG4 18kPV All-In-One Hybrid Inverter
Combines an 18kW solar PV array input, a 12kW split-phase 120V/240V inverter, a 200A whole-home automatic transfer switch, and seamless open-protocol 48V LiFePO4 battery communication in one weatherproof enclosure.
Check EG4 18kPV Pricing →
Interactive Sizing and Financial Estimators
To calculate the exact battery capacity and solar generation required to offset your utility bill, test your appliances with our calibrated laboratory tools:
Simulate Your Home Solar & Battery Offset
Input your average monthly kilowatt-hour consumption to see precise battery backup runtimes, daily solar generation curves, and recommended inverter wattages.
Open Solar Generator Runtime Calculator →
Frequently Asked Questions (FAQ)
What is the average return on investment (ROI) for residential solar?
The average residential solar installation in the United States achieves an Internal Rate of Return (IRR) between 12% and 22%, with a simple payback period of 6 to 8 years for professionally installed systems (and 4 to 5 years for DIY kits). Over a 25-year operational lifespan, net financial savings range from $35,000 to over $75,000, depending on local utility electricity rates and annual sunlight hours.
How does the 30% Federal Clean Energy Tax Credit work?
Under Section 25D of the Internal Revenue Code, homeowners who purchase their solar panels and battery storage outright (via cash or loan) can claim a dollar-for-dollar tax credit equal to 30% of total project costs on their federal income taxes. If your total tax liability for that year is less than the credit, the remaining balance rolls over to offset taxes in subsequent tax years.
Will solar panels increase my property taxes?
In the vast majority of US states (including California, Texas, Florida, New York, and Arizona), residential solar energy systems are 100% exempt from local property tax assessments. While an owned solar system increases home market resale value by roughly $4,000 per installed kilowatt, state legislation prevents local tax assessors from raising your property taxes based on that added clean energy value.
What maintenance costs should I expect over 25 years?
Rooftop solar systems have no moving parts and require minimal maintenance. Typical maintenance involves occasional hose rinsing to clear dust or pollen (roughly $0 to $150 annually if contracted). The only significant scheduled maintenance expense over a 25-year period is replacing the string inverter around year 12 to 15 (budget roughly $1,500 to $2,500). Tier-1 solar panels themselves are warrantied to produce power for 25 to 30 years without intervention.