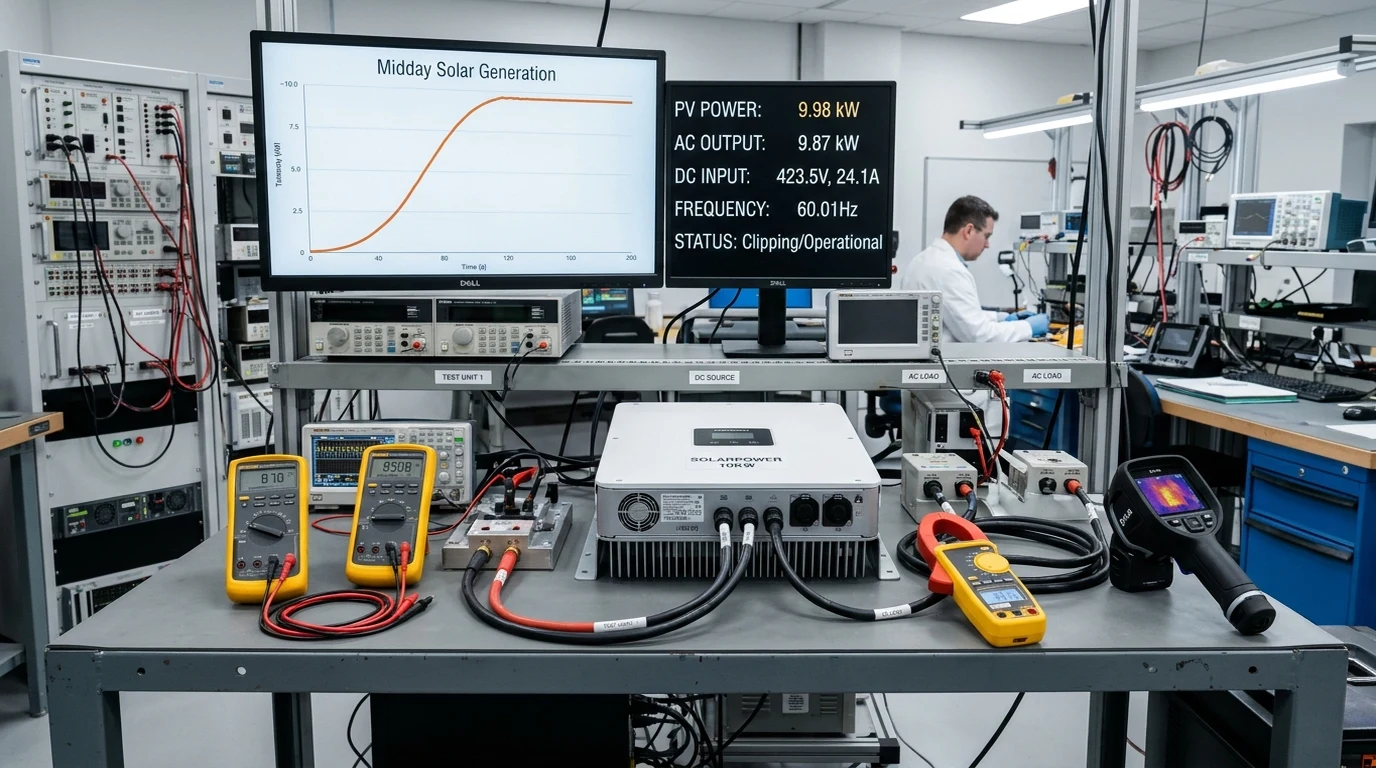
Executive Summary: The Economics and Engineering of Solar Inverter Clipping
One of the most persistent misconceptions among solar owners and novice system designers is the belief that a photovoltaic array must match the inverter’s nameplate AC rating on a strict one-to-one basis. When a system owner installs a ten-kilowatt DC rooftop array only to discover their inverter flat-lines at seven point six kilowatts during crisp spring middays, the instinctive reaction is alarm: Is my system malfunctioning? Is my inverter overheating? Am I wasting money?
In professional photovoltaic engineering, this phenomenon is known as inverter clipping (or inverter saturation). Far from being a design flaw, intentional oversizing of the DC array relative to the inverter’s AC continuous output—establishing a DC-to-AC ratio (also termed the Inverter Loading Ratio or ILR) between 1.20 and 1.40—is standard utility-scale and commercial design practice.
The core engineering objective is not to maximize peak instantaneous wattage during the single sunniest hour of a spring day, but to maximize total cumulative kilowatt-hours delivered across all daylight hours throughout the year. By oversizing the DC array, the system achieves a broader, fuller production curve, generating substantially more usable energy during morning, late afternoon, and overcast conditions, while accepting a modest, mathematically calculated peak truncation at solar noon.
Defining the Direct Current to Alternating Current Ratio: Why Oversizing Is Standard
The DC-to-AC ratio quantifies the relationship between the peak standard test conditions (STC) rating of the solar field and the continuous alternating current output capability of the power conversion equipment:
Where:
- is the cumulative nameplate wattage of all installed PV modules at irradiance and cell temperature.
- is the maximum continuous AC power output of the string or hybrid inverter at nominal utility grid voltage.
+--------------------------------------------------------------+
|       DAILY GENERATION PROFILE: 1.00 VS 1.30 DC/AC RATIO     |
+--------------------------------------------------------------+
|                                                              |
|   AC Power                                                   |
|   (Watts)                                                    |
|                                                              |
|   Inverter Max  + - - - - - - [CLIPPED PEAK] - - - - - - -+  |
|   AC Output     |           .-----------------.           |  |
|                 |          /                   \          |  |
|                 |         /  +---------------+  \         |  |
|                 |        /   | Unharvested   |   \        |  |
|                 |       /    | Energy (1-3%) |    \       |  |
|                 |      /     +---------------+     \      |  |
|                 |     /                             \     |  |
|                 |    /   1.30 DC/AC Curve            \    |  |
|                 |   /                                 \   |  |
|                 |  /    1.00 DC/AC Curve               \  |  |
|                 | /           /-----\                   \ |  |
|                 |/           /       \                   \|  |
|                 +-----------+---------+-------------------+  |
|                 6 AM       9 AM     NOON      3 PM       6 PM|
|                                                              |
|                 |<-- GAIN ->|                 |<-- GAIN ->|  |
|                 Morning Shoulder              Afternoon       |
|                 Hour Production               Shoulder Gain   |
+--------------------------------------------------------------+
Shoulder Hour Yield Expansion Versus Midday Peak Power Truncation
Solar irradiance follows a diurnal bell curve. Standard test condition ratings assume sunlight intensity of one thousand watts per square meter, an irradiance level achieved only for brief intervals around solar noon under cloudless skies. For the vast majority of daylight hours—during early morning ramp-up, late afternoon ramp-down, and diffuse cloudy conditions—solar irradiance hovers between two hundred and six hundred watts per square meter.
When a system is designed with a parity ratio of one-to-one (e.g., a five-kilowatt array paired with a five-kilowatt inverter):
- At noon under peak conditions, the inverter operates at full capacity.
- At eight in the morning and four in the afternoon, the five-kilowatt array produces barely one point five kilowatts, leaving the inverter heavily underutilized.
Conversely, if the same five-kilowatt inverter is paired with a six point five kilowatt array (a ratio of one point thirty):
- During morning and evening shoulder hours, the array delivers thirty percent more instantaneous power, waking the inverter earlier and sustaining household loads long into the evening.
- Overcast days see a thirty percent increase in diffuse light harvesting.
- At solar noon, generation exceeding five kilowatts is clipped, but this truncated energy represents less than two percent of total annual potential yield.
The net result is a massive net annual gain in total energy harvest (kilowatt-hours) for a nominal investment in extra PV modules, with zero increase in balance-of-system inverter, breaker, or conduit costs.
Maximum Power Point Voltage Shifting Dynamics During Inverter Saturation
A common fear among equipment owners is that the inverter acts as a mechanical brake or resistor, absorbing excess kilowatts as destructive internal heat. This is physically incorrect.
To prevent over-current conditions, the inverter’s internal Maximum Power Point Tracking (MPPT) firmware executes an elegant electronic throttling maneuver: voltage shifting.
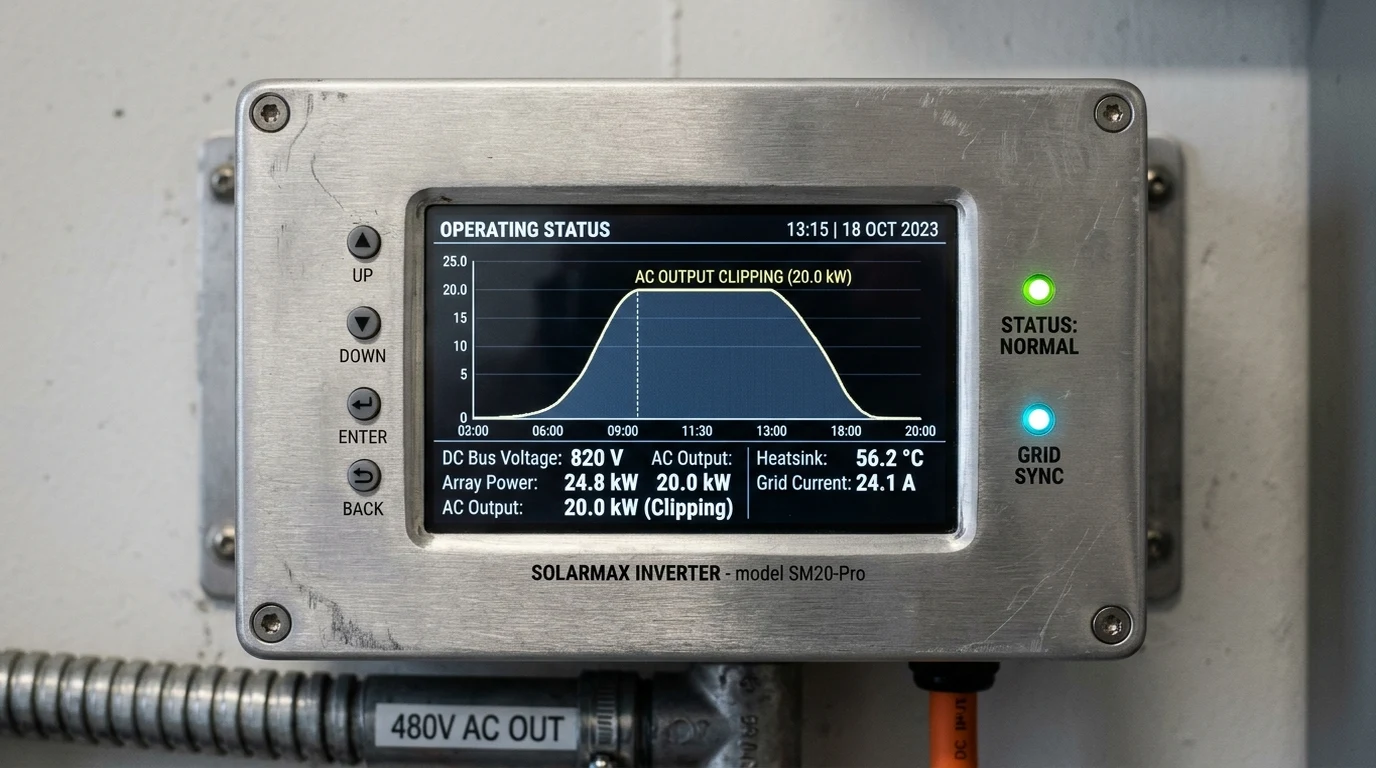
A solar panel possesses a unique Current-Voltage (I-V) and Power-Voltage (P-V) characteristic curve:
+--------------------------------------------------------------+
|            SOLAR CELL I-V CURVE AND CLIPPING POINT           |
+--------------------------------------------------------------+
|                                                              |
|   Current (Amps)                                             |
|   I_sc  +-----------------\                                  |
|         |                  \                                 |
|         |                   \                                |
|         |      MPPT Point    * (V_mp, I_mp) -> Max Power     |
|         |                     \                              |
|         |                      \  [CLIPPING ZONE]            |
|         |                       \  Inverter drives voltage   |
|   I_clip|........................* higher to reduce current  |
|         |                         \                          |
|         +--------------------------+-----------------------+ |
|         0                         V_mp      V_clip       V_oc|
|                                     Voltage (Volts)          |
+--------------------------------------------------------------+
Under normal operation, the MPPT constantly perturbs and observes string voltage to locate the peak of the curve (), where the product of voltage and current () is maximized.
When the inverter reaches its continuous thermal or current processing limit:
- The firmware recognizes that extracting additional current will violate AC bridge ratings.
- The MPPT deliberately shifts the operating voltage higher up the curve toward open-circuit voltage ().
- As operating voltage rises toward , the physics of the semiconductor P-N junction dictates that current drops sharply toward zero.
- The inverter extracts only the exact current required to satisfy its rated AC limit ().
The surplus potential energy is never drawn from the panels. It remains unharvested as harmless radiant heat and photon reflection at the module glass surface. The inverter stays cool and electrically unstressed.
Thermodynamics of Inverter Saturation: Does Clipping Stress Internal Components?
While clipping does not force the inverter to dissipate unharvested PV wattage, operating an inverter at its continuous maximum output rating for three to four consecutive hours daily introduces real thermodynamic variables that engineers must evaluate.
Thermal Dissipation Across Power Semiconductor Switches
The primary heat source inside a solar inverter is switching and conduction losses across its Insulated-Gate Bipolar Transistors (IGBTs) or Silicon Carbide (SiC) MOSFET bridge:
Where:
- is the continuous alternating current flowing through the bridge,
- is the internal resistance of the semiconductor channel,
- is the PWM switching frequency (typically sixteen to forty kilohertz).
Because an oversized array holds the inverter at its maximum rated AC current for several hours during midday, internal power electronics operate at peak thermal equilibrium for longer durations than in an undersized system.
High-quality commercial inverters (such as Fronius Primo, SMA Sunny Boy, Sol-Ark 15K, or SolarEdge Energy Hub) are engineered with oversized aluminum extruded heatsinks, heat pipes, and variable-speed brushless DC cooling fans rated for continuous duty at full nameplate capacity in ambient temperatures up to forty-five or fifty degrees Celsius. However, poor physical installation—such as mounting the inverter on a direct-sun south-facing unshaded exterior wall or within an unventilated garage—will cause internal heatsink temperatures to cross eighty degrees Celsius, triggering protective thermal derating.
Capacitor Bank Ripple Current and Long-Term Degradation Profiles
The most age-sensitive components inside any grid-tied or hybrid inverter are the DC bus electrolytic filter capacitors. These capacitors smooth the high-frequency voltage ripple generated by the switching bridge.
Capacitor degradation follows the classical Arrhenius chemical rate equation: for every ten degrees Celsius increase in continuous operating core temperature, the operational lifespan of electrolytic electrolyte fluid is halved:
When an inverter operates in continuous midday saturation, ripple currents through the DC bus reach maximum design limits. Inverters manufactured with top-tier Japanese or German one-hundred-and-five-degree-rated capacitors easily achieve fifteen to twenty-year lifespans under heavy clipping profiles. However, budget consumer inverters equipped with marginal eighty-five-degree capacitors can suffer premature drying of liquid electrolyte, manifesting as elevated DC bus voltage ripple and eventual hardware fault trips after six to eight years.
Modeling Clipping Losses: Irradiance Distributions and Cell Temperature Physics
Calculating the true energy impact of inverter clipping requires understanding how outdoor environmental conditions modify the standard test condition ratings of solar panels.
Ambient Temperature Derating and Open-Circuit Voltage Compression
Photovoltaic modules are rated in factory laboratories at an ambient cell temperature of twenty-five degrees Celsius (seventy-seven degrees Fahrenheit). In actual field conditions, dark silicon wafers absorb substantial solar radiation, operating at twenty to thirty-five degrees Celsius above ambient air temperature.
Under bright summer conditions with an ambient air temperature of thirty-two degrees Celsius (), solar cell operating temperature easily reaches sixty degrees Celsius ().
Silicon solar cells exhibit a negative temperature coefficient of maximum power (), typically ranging from to per degree Celsius:
Calculating Summer Thermal Power Loss
For a ten-kilowatt DC array utilizing modern monocrystalline PERC or TOPCon modules with operating at sixty degrees Celsius:
Due entirely to ambient thermal physics, a ten-kilowatt array rarely delivers more than eight point eight kilowatts of real DC power to the inverter on hot summer days.
Consequently, pairing a ten-kilowatt DC array with an eight-kilowatt or seven point six kilowatt inverter produces far less clipping than theoretical STC numbers suggest. True severe clipping occurs almost exclusively on cold, crystal-clear spring days in March and April, when solar irradiance exceeds one thousand watts per square meter while cell temperatures remain below twenty degrees Celsius due to brisk winds.
Mathematical Quantification of Annual Energy Clipping Losses
Using comprehensive NREL SAM (System Advisor Model) meteorological simulations, engineers can quantify the precise trade-off between array oversizing and annual energy losses.
| DC-to-AC Ratio (ILR) | Total Array Size (DC) | Inverter Rating (AC) | Annual Energy Harvested (kWh) | Annual Clipped Energy (%) | Effective System Capacity Factor |
|---|---|---|---|---|---|
| 1.00 (Parity) | 7.6 kW | 7.6 kW | 11,400 kWh | 0.00% | 17.1% |
| 1.15 (Mild) | 8.74 kW | 7.6 kW | 13,050 kWh | 0.15% | 19.6% |
| 1.25 (Optimal Utility) | 9.50 kW | 7.6 kW | 14,080 kWh | 0.85% | 21.1% |
| 1.35 (Optimal Commercial) | 10.26 kW | 7.6 kW | 15,020 kWh | 2.10% | 22.5% |
| 1.50 (Aggressive) | 11.40 kW | 7.6 kW | 16,180 kWh | 5.40% | 24.2% |
| 1.70 (Severe) | 12.92 kW | 7.6 kW | 17,210 kWh | 11.20% | 25.8% |
Notice the critical inflection point: moving from a ratio of 1.00 to 1.35 increases annual usable energy from 11,400 kWh to 15,020 kWh—a massive gain of 3,620 kilowatt-hours per year—at the cost of sacrificing barely 2.1% of potential midday peak generation.
Optimal Ratio Guidelines for Fixed Roofs and Off-Grid Storage
Selecting the correct oversizing ratio requires assessing system architecture, interconnection limitations, and battery storage topology.
+--------------------------------------------------------------+
|             SYSTEM TOPOLOGY RATIO RECOMMENDATIONS            |
+--------------------------------------------------------------+
|                                                              |
|   Standard South-Facing Grid-Tied String Inverter:           |
|   Recommended Ratio: 1.20 to 1.28                            |
|                                                              |
|   East-West Split Azimuth Rooftop Array:                     |
|   Recommended Ratio: 1.35 to 1.45                            |
|   (Solar peaks are staggered, virtually eliminating clipping)|
|                                                              |
|   DC-Coupled Hybrid Inverter with 48V Battery Bank:          |
|   Recommended Ratio: 1.40 to 1.60                            |
|   (Excess power routes to chemical battery storage)          |
|                                                              |
|   AC-Coupled Off-Grid Inverter System:                       |
|   Recommended Ratio: 1.15 to 1.25                            |
|   (Strictly bounded by the 1:1 Inverter Sizing Rule)         |
|                                                              |
+--------------------------------------------------------------+
Grid-Tied Interconnection Limits and Export Constraint Sizing
In many residential jurisdictions, utility companies enforce strict interconnection limits on continuous AC inverter backfeed based on local distribution transformer capacity or customer main service panel busbar ratings (the NEC 705.12 one-hundred-and-twenty-percent busbar rule).
For example, a home with a two-hundred-amp service panel and a forty-amp solar backfeed breaker is legally limited to a maximum continuous inverter output of 7,680 Watts ().
If the homeowner’s annual electricity consumption requires thirteen thousand kilowatt-hours, installing a standard seven point six kilowatt array at a one-to-one ratio will leave them hundreds of kilowatt-hours short of net-zero status. By oversizing the DC array to ten point five kilowatts (a ratio of 1.38) behind the legally compliant seven point six kilowatt inverter:
- The system never violates utility export constraints.
- Morning and afternoon production surges, supplying home loads directly.
- The household achieves total net-zero energy balance within existing electrical service boundaries.
Battery Coupled Hybrid Inverters and DC Charge Routing Headroom
In modern off-grid and whole-home backup installations utilizing DC-coupled hybrid inverters (such as the EG4 18KPV, Sol-Ark 15K, or Deye 12kW), inverter clipping can be completely eliminated.
Hybrid inverters feature dual internal power paths:
- An AC Inversion Bridge that converts DC to 120V/240V split-phase AC power.
- A Bidirectional DC-to-DC Buck-Boost Converter that links the high-voltage MPPT bus directly to a 48V or high-voltage lithium battery bank.
+--------------------------------------------------------------+
|           DC-COUPLED HYBRID CLIPPING DIVERSION PATH          |
+--------------------------------------------------------------+
|                                                              |
|   PV Array Input: 15,000 Watts DC                            |
|         |                                                    |
|         v                                                    |
|   +------------------------------------------------------+   |
|   | Hybrid Inverter Core MPPT Bus                        |   |
|   +------------------------------------------------------+   |
|         |                                      |             |
|         | Path A: Continuous AC Bridge         | Path B:     |
|         | Max Inverter Limit: 12,000W          | DC Charger  |
|         v                                      v             |
|   +-------------------+              +-------------------+   |
|   | Household AC Main |              | 48V LiFePO4       |   |
|   | Electrical Panel  |              | Battery Bank      |   |
|   | (12,000W Output)  |              | (3,000W Surplus)  |   |
|   +-------------------+              +-------------------+   |
|                                                              |
|   Result: ZERO Clipped Energy. 100% PV Power Harvested.      |
+--------------------------------------------------------------+
When solar array production reaches fifteen kilowatts on a twelve-kilowatt hybrid inverter, the AC bridge delivers its maximum twelve kilowatts to home appliances or grid export, while the onboard MPPT controller simultaneously channels the remaining three kilowatts directly into the LiFePO4 battery bank. The array operates at its true maximum power point, achieving one hundred percent energy utilization with zero clipping loss.
Complete Solar Array Oversizing and Inverter Commissioning Checklist
Before finalizing an oversized array design or diagnosing clipping behavior in an existing installation, engineers should execute this commissioning protocol:
[ ] Maximum DC Input Voltage Audit: Calculate Cold-Weather Open-Circuit Voltage
    (V_oc_cold) using local record-low ambient temperatures; verify total string
    voltage never exceeds inverter maximum rating (e.g., 500V or 600V limit).
[ ] Maximum Usable Input Current (I_sc) Check: Ensure array short-circuit current
    does not exceed the inverter MPPT maximum short-circuit rating.
[ ] Inverter Loading Ratio Calculation: Confirm planned DC-to-AC ratio matches
    climate zone (1.20-1.30 for sunny desert climates; 1.30-1.45 for cloudy regions).
[ ] East-West String Optimization: For multi-azimuth arrays, distribute strings across
    opposing roof faces to flatten the generation curve and prevent midday peaks.
[ ] Shading and Clearance Audit: Provide minimum 12-inch clearance around inverter
    heatsinks; ensure outdoor units are shaded from direct afternoon western sun.
[ ] Firmware Telemetry Verification: Monitor MPPT operating voltage during midday
    saturation to confirm smooth upward voltage shifting without oscillation.
[ ] Hybrid Battery Diversion Calibration: In hybrid systems, verify battery charge
    parameters allow simultaneous full AC output plus maximum battery charge current.
By engineering solar systems around optimized DC-to-AC oversizing ratios, solar professionals and DIY homesteaders transform standard power inverters into high-efficiency energy machines, maximizing annual kilowatt-hour yields while protecting equipment longevity for decades of reliable service.